Easy Apples-to-Apples Reporting

Article Highlights:
- Easily compare month-to-month performance of one or multiple dealerships.
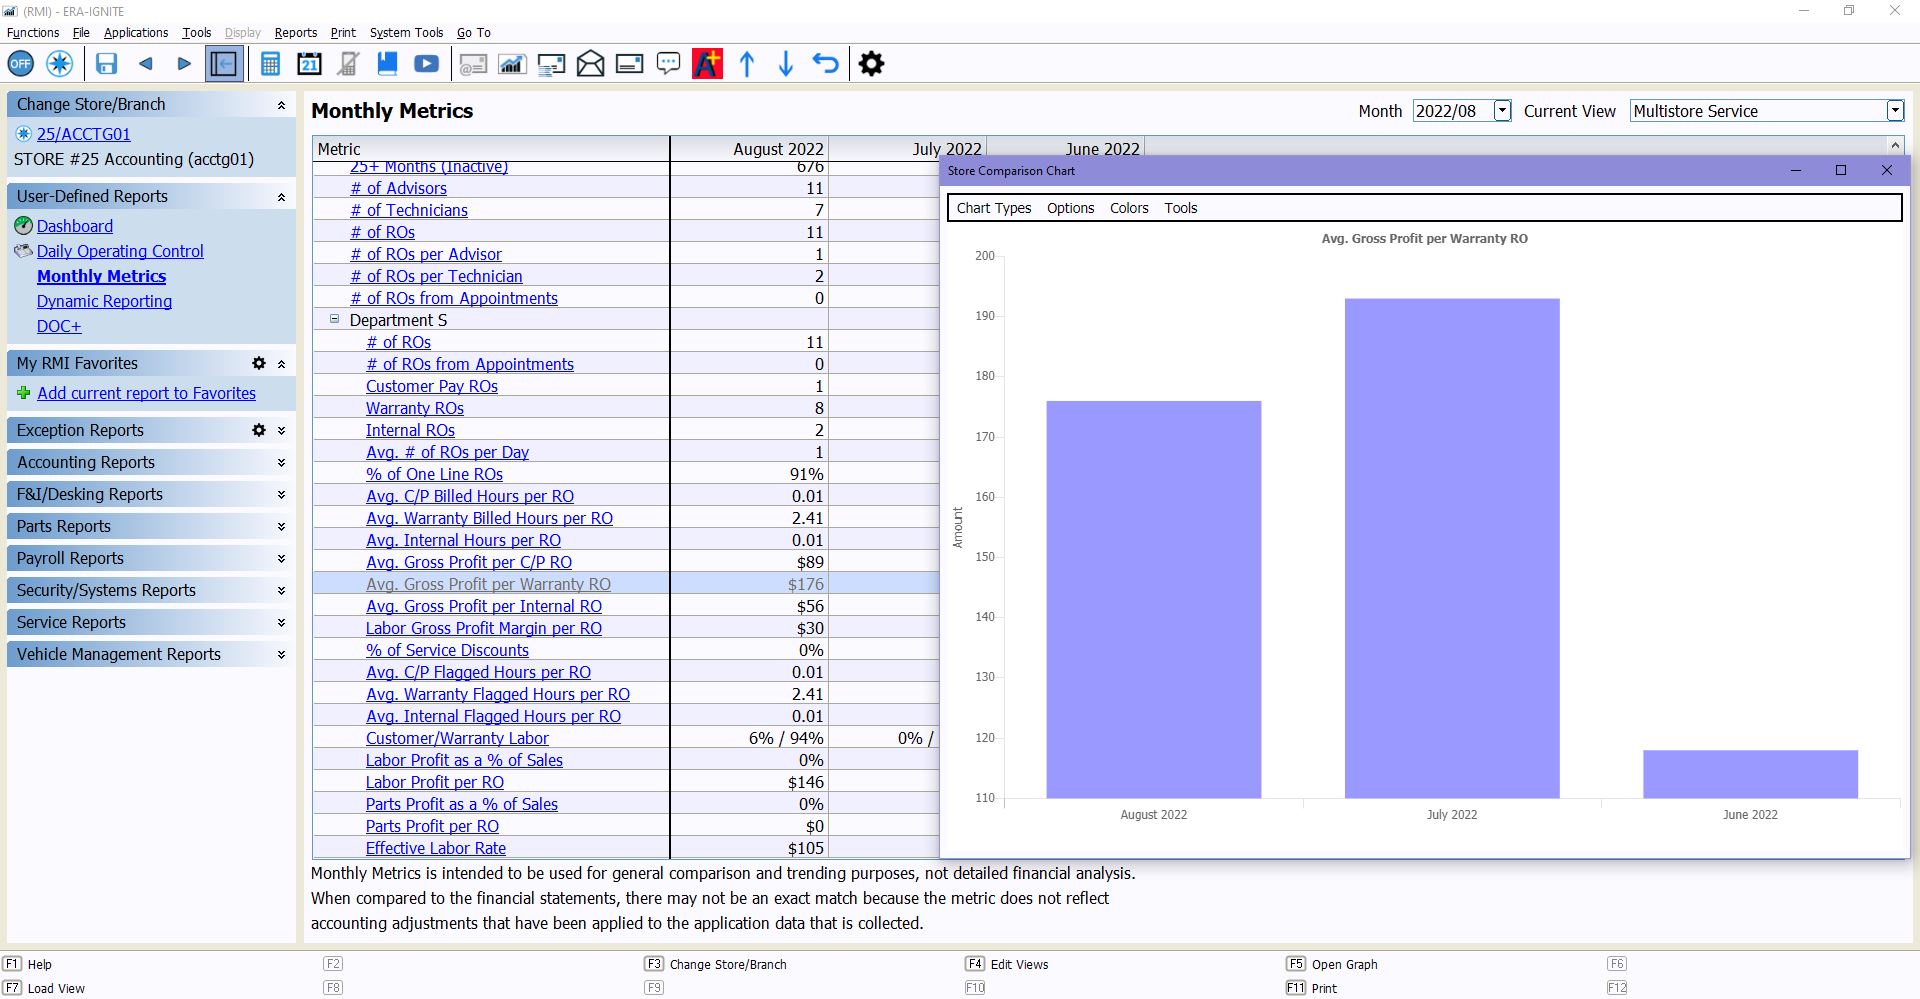
- “Open Graph” feature displays the performance of each store in one graph.
One of the harder tasks executives and managers sometimes face is trying to gather performance comparison data for multiple time periods, departments, or stores.
What you’re after is a true “apples-to-apples” comparison, but it isn’t always easy to compile the numbers you need to make a fair evaluation of where you are compared to other stores or a previous time period.
Easy Apples-to-Apples Reporting
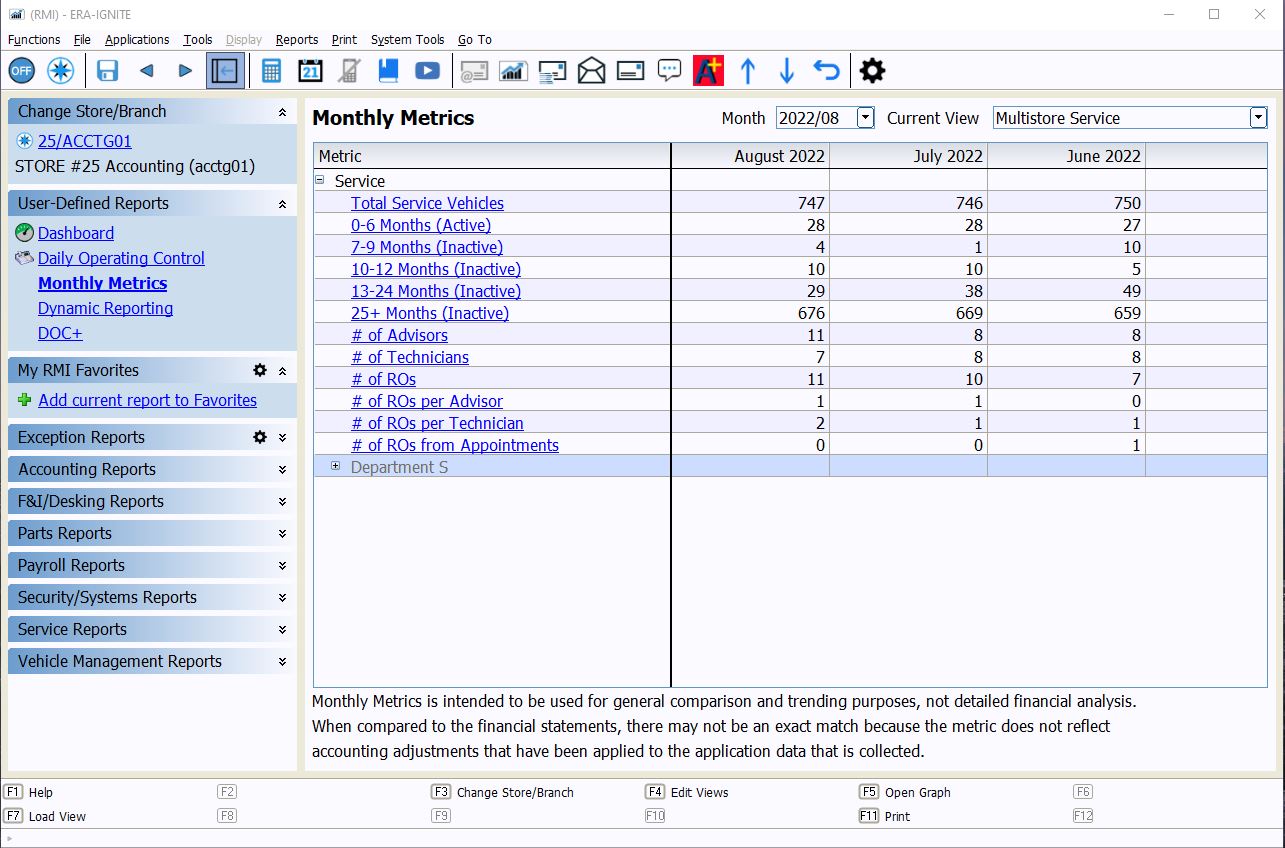
Using the new Monthly Metrics feature of ERA-IGNITE Retail Management Intelligence, you can easily compare month-to-month performance of one or multiple dealerships.

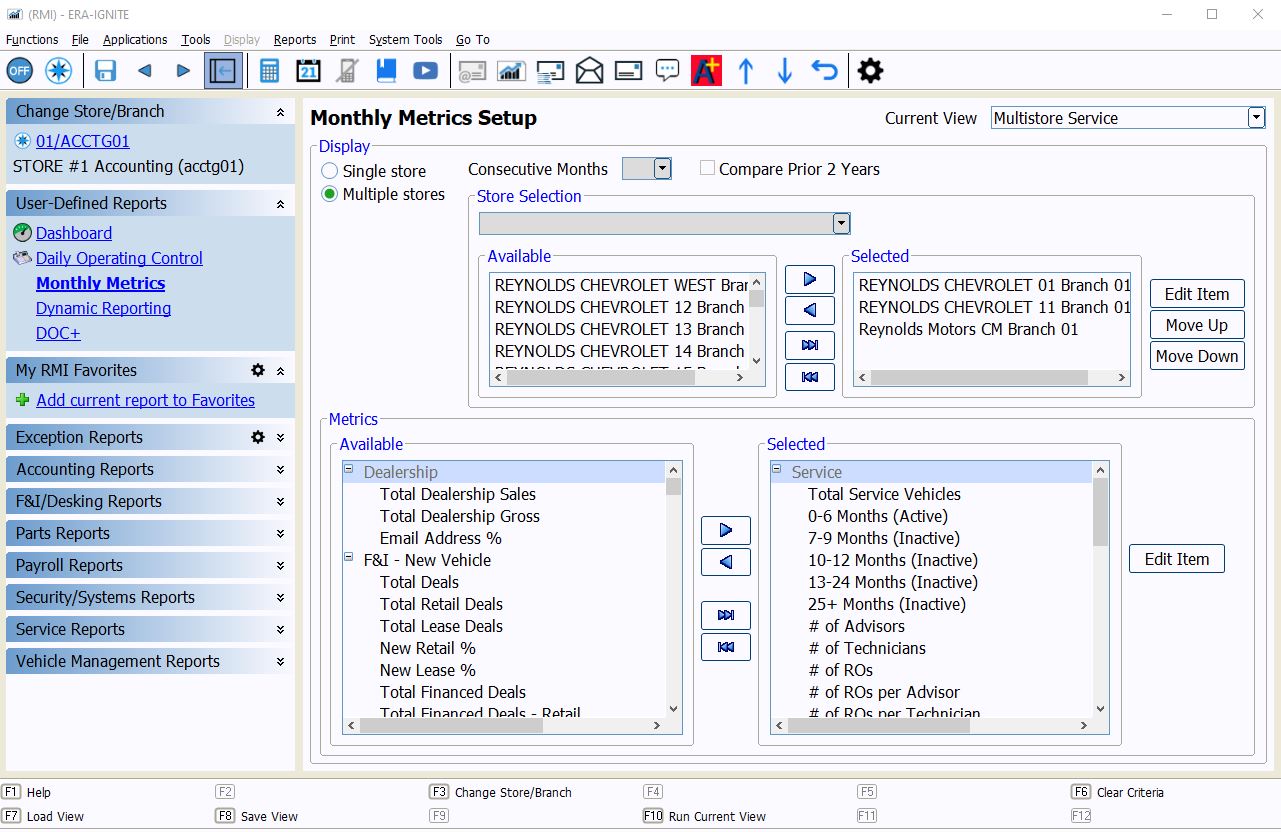
Monthly Metrics (a.k.a. “views”) allow you select the metrics you want to compare for each area of your dealership from a vast array of metrics across all departments.

To make it even easier to compare multiple dealerships, use the handy “Open Graph” feature to display the performance of each store within a single, easy-to-read graph.

The next time you’re reviewing your organization’s performance, use Monthly Metrics to help you gather all the data you need.
Related Articles:

ERA-IGNITE Keyboard Shortcuts (With Printable Reference Sheet)
Keyboard shortcuts can do wonders for your everyday tasks. Here’s an updated list of the most common shortcuts in ERA-IGNITE.

Visual Learner? Help videos are available in ERA-IGNITE to assist you.
Prefer to learn from watching a video rather than reading a manual? Check out ERA-IGNITE Smart Center to jumpstart your learning.

Track Your Contracts in Transit With the Heat Sheet
One of the most important metrics you monitor in F&I is your contracts in transit. With ERA-IGNITE F&I Heat Sheet, tracking your funding is simplified.

Mobile Time Clock: Getting Started with Geofencing
Simplify the time punch process and establish boundaries using geofences with Mobile Time Clock.


